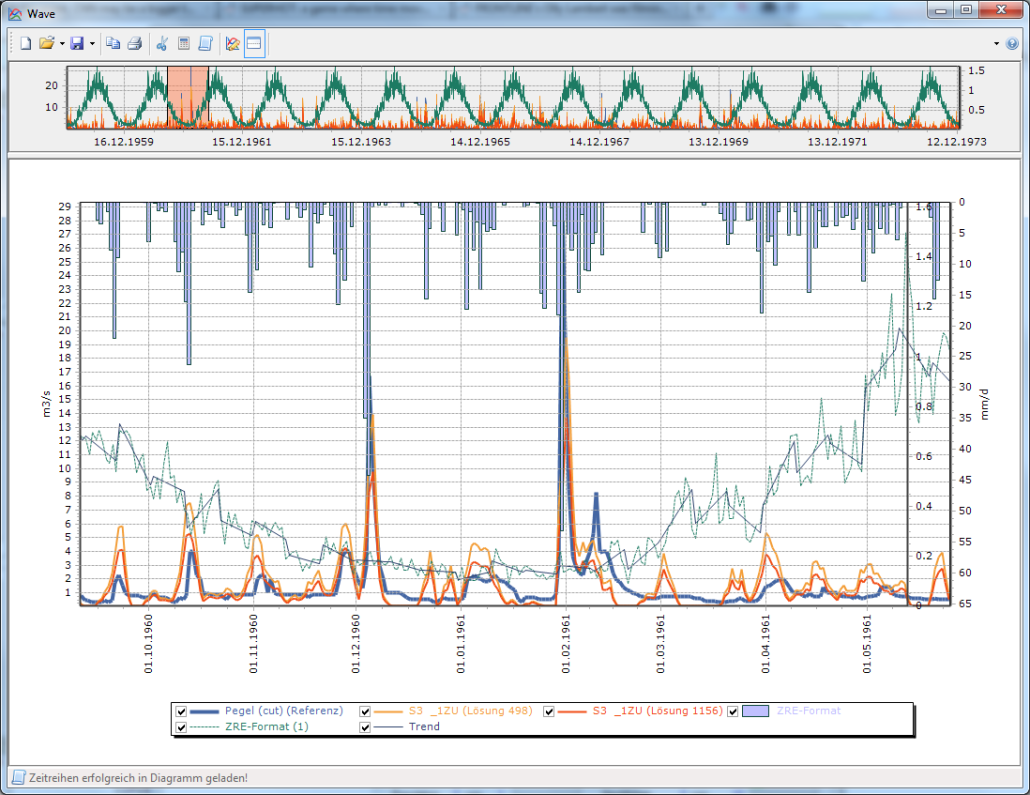
BlueM.Wave is a tool for visualizing and analyzing input and output time series. Simulation results from BlueM.Sim can be displayed directly in BlueM.Wave. Several other time series formats and the common text format CSV (comma separated values) can also be imported. Furthermore, time series can be added manually or pasted from other applications like spreadsheets.
Charts can have an unlimited number of axes, making it easy to visualize different simulation results. Time series can be clipped, both for display and for export.
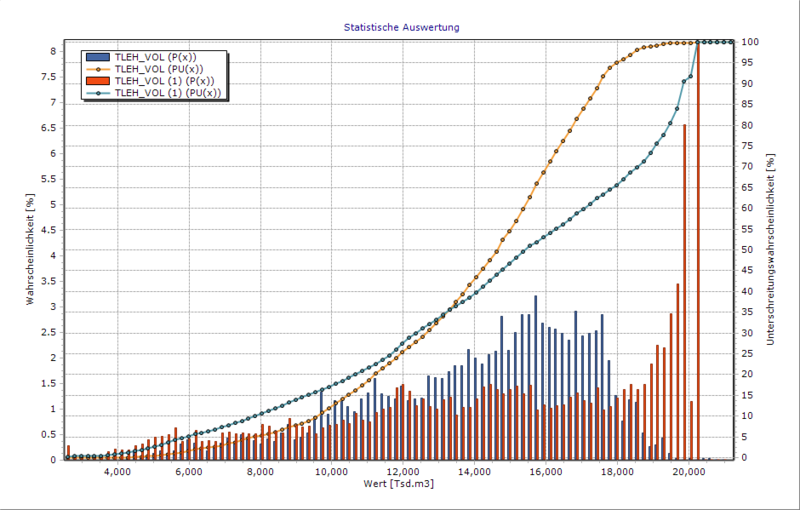
Implemented analysis methods are a monthly evaluation of mean, median, minimum, maxi-mum, and standard deviation values; double sum analysis; various goodness of fit measures (volume error, sum of error squares, coefficient of determination, Nash-Sutcliffe efficiency, and hydrologic deviation); and probability distribution of time series.