BlueM is a software package for integrated river basin management. Its components allow for simulation, analysis and optimization of water quantity and quality fluxes and processes in catchments with complex land use. Different interfaces allow the coupling of BlueM’s components with other software.
Simulation
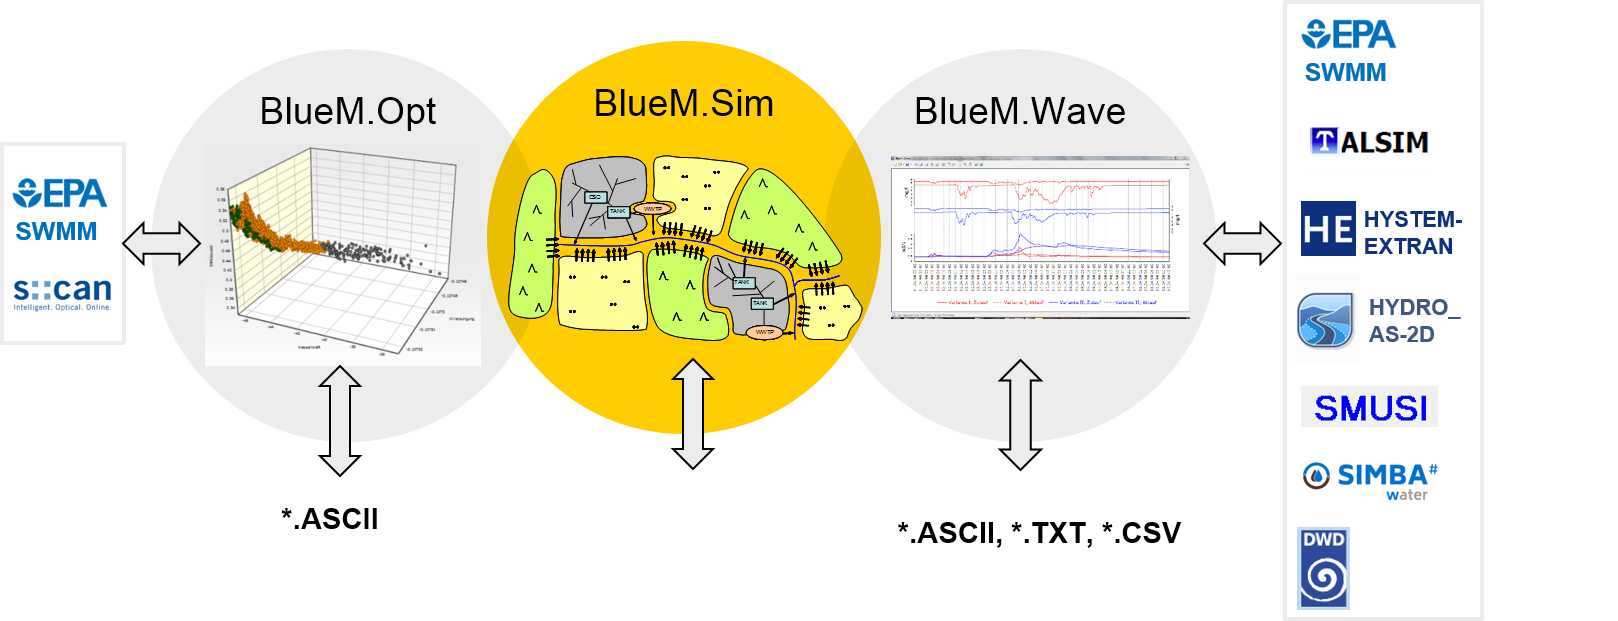
The model core BlueM.Sim allows for rainfall runoff computations of water quantity fluxes and water quality processes in rural and urban catchment parts using physically-based approaches.
The model core BlueM.Sim allows for rainfall runoff computations of water quantity fluxes and water quality processes in rural and urban catchment parts using physically-based approaches.
Optimization
BlueM.Opt allows for sensitivity analyses, auto calibration and multi criteria optimization including result visualization.
BlueM.Opt allows for sensitivity analyses, auto calibration and multi criteria optimization including result visualization.
GIS interface
BlueM.GIS is an interface between a Geograpic Information System and the hydrological simulation model BlueM.Sim.
BlueM.GIS is an interface between a Geograpic Information System and the hydrological simulation model BlueM.Sim.
Linking
BlueM.Sim is equipped with OpenMI-inferfaces, which allows it to be coupled with other OpenMI-compliant models. BlueM.Wave has import interfaces for several time series formats.
BlueM.Sim is equipped with OpenMI-inferfaces, which allows it to be coupled with other OpenMI-compliant models. BlueM.Wave has import interfaces for several time series formats.