BlueM.Wave v1.6.1 has been released!
It’s been more than a year since the release of v1.6 and quite a few additions, changes and improvements have been made to BlueM.Wave.
Changelog
New features and improvements
- Added support for loading and saving Wave project files (*.wvp) (#705)
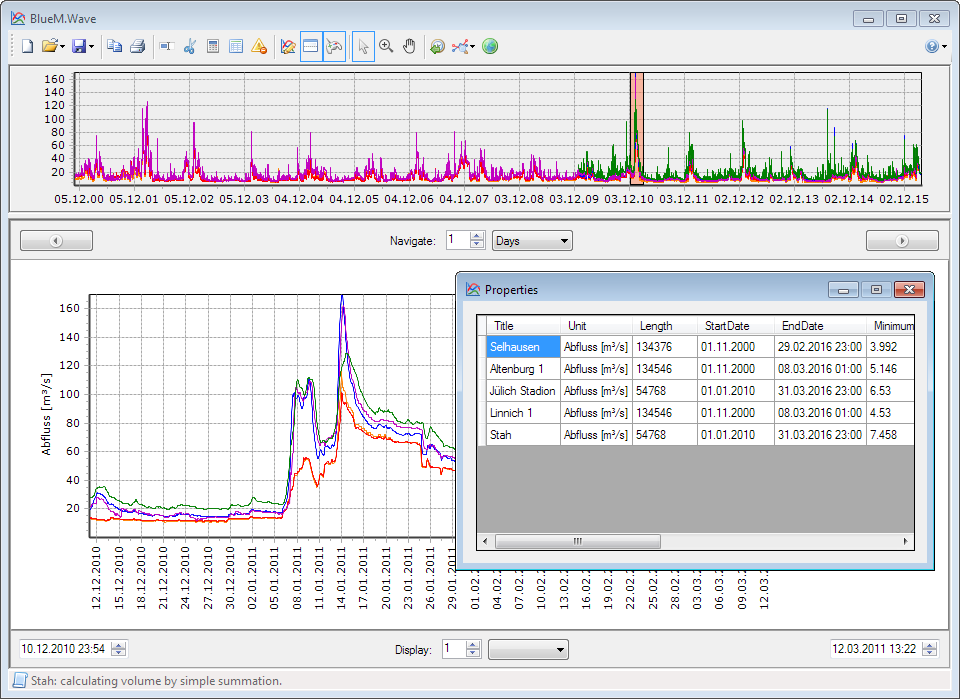
- Added a button for displaying time series properties in a table view (#711)
- Added the ability to load TALSIM simulation results using the clipboard (by pressing Ctrl+V) (#695)
- Added an “AnnualStatistics” analysis function which calculates statistics such as min, max, avg and volume of a time series for each hydrological year
- The “Comparison” analysis function now fits a simple linear regression line to the data (using the Math.NET Numerics library)
- The analysis function “Histogram” now allows the user to specify the bins (#397). Also, the histogram result data is now written to the log.
- The analysis function “MonthlyStatistics” now writes the result data to the log
- Added a button for removing user-specified error values from series
- Added a button for renaming series
- Added a dropdown button for zooming to a specific series
- Added support for exporting series to CSV format (#318)
- Added support for importing files in the ZRXP format (*.zrx)
- “GoodnessOfFit” (GoF) analysis function:
- Added “Logarithmic Nash-Sutcliffe Efficiency” as a new GoF parameter
- The GoF parameters can now optionally be calculated for individual hydrological years
- Added support for importing BW_TMP.DAT result files from HYDRO_AS-2D
Changes
- Error values in time series such as e.g. -777 and -9999 are now imported and displayed as regular values. Previously, when importing from BIN and DWD-T-L format, these would be replaced with NaN. The new “Remove error values” function can be used to remove these error values, if desired. (#693)
- Analysis “GoodnessOfFit“: Volume error is based on actual volume integrated over time if the time series unit ends with “/s”
- Removed support for the DWD-T-L format
- If a time series contains duplicate nodes, the duplicate nodes are now simply discarded and a warning is written to the log instead of aborting the import
Fixes
- The decimal mark selector in the import series dialog now actually works (#351)
- “Comparison” analysis function: changed the result series to a point series because a line series in TeeChart automatically sorts itself by the x-values and thus connects the points in the wrong order (not time-based)
Download
Download the new version from our download page.
Feedback is welcome!
– The BlueM Dev Team